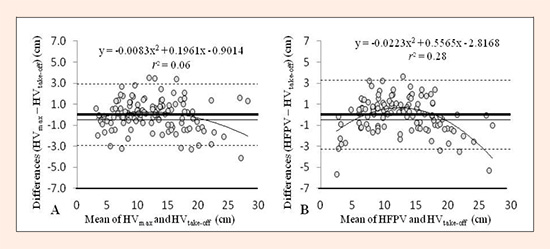
Figure 3. Bland–Altman plots showing differences between HVmax vs. HVtake-off (A) and HFPV vs. HVtake-off (B). Each plot shows the mean difference and 95% limits of agreement (dashed lines), along with the regression line (solid line). HVtake-off = jump height derived from take-off velocity; HVmax = jump height derived from maximum velocity; HFPV = jump height derived from final propulsive phase velocity.