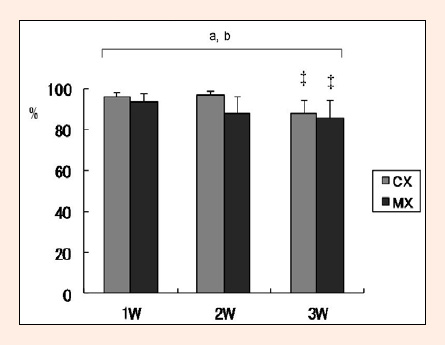
Figure 3. Relative percentages of fibers with central nuclei. CX: cardiotoxin (CTX)-injected group, MX: CTX-injected with MENS treatment group. Values are means ± SEM. n=5 in each group. When the significant main effect (treatment or time) analyzed by using two-way ANOVA (treatment x time) was observed, the results were shown using “a” (treatment) or “b” (time). Significant differences of the data between 1 and 3 weeks were shown using ‡, (p < 0.05).