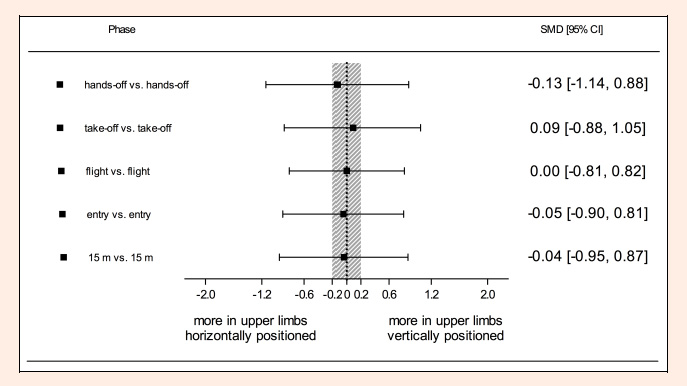
Figure 3.
Standardized mean difference and 95% CI for start phase and 15 m time from comparisons between start variants. The shaded area represents the smallest (trivial differences) worthwhile change.