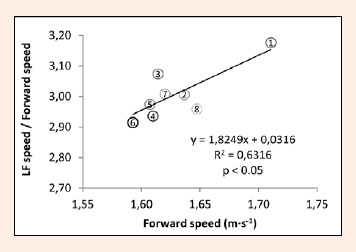
Figure 3. Graphical representation of the relationship be-tween forward and lateral speeds. The mean forward speed of each length (numbers within circles) is scattered versus the ratio between the mean LF speed and mean forward speed, which could be regarded as an "index" of speed wastage. The relevant regression line is also shown.