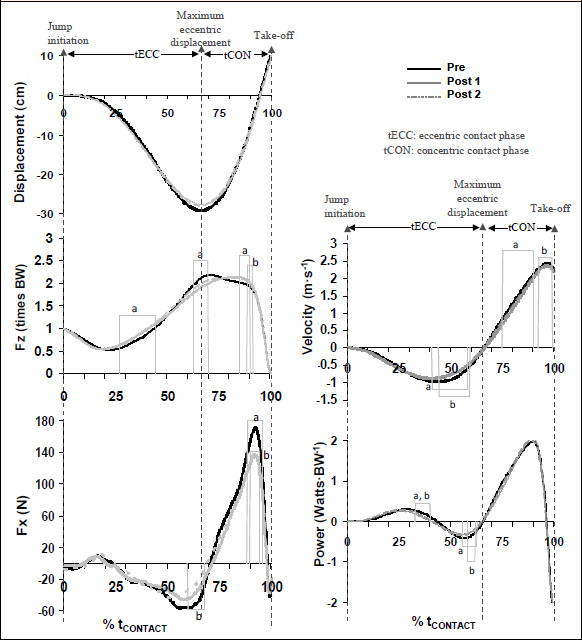
Figure 3. Time–curves: Displacement– (Right top), Fz– (Right center), Fx– (Right bottom), Velocity– (Left top) and Power– (Left bottom) time curves, in Pre (Black line), Post 1 (Solid grey line) and Post 2 (Dotted grey line), respectively. Time is expressed as a percentage of total contact duration (% tCONTACT). The time intervals of significant Pre – Post 1 (a), Pre – Post 2 (b) and Post 1 – Post 2 (c) differences (p ≤ 0.05) are noted.