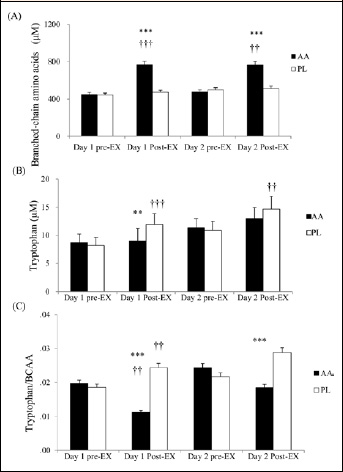
Figure 3. Plasma concentrations of (A) BCAA and (B) tryptophan, and (C) tryptophan/BCAA ratio in the AA and PL trials. Main effects: (A) trial: p < 0.001; time: p < 0.001; interaction: p < 0.001; (B) Main effects: trial: p = 0.005; time: p < 0.001; interaction: p = 0.003; (C) Main effects: trial: p < 0.001 ; time: p = 0.040; interaction: p < 0.001. *p < 0.05; ** p <0 .01; *** p < 0.001, AA vs PL trial at the same time point. † p < 0.05; † † p < 0.01; † † † p < 0.001, different from the pre-Ex at the same day in the same trial