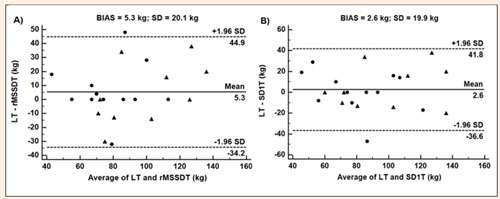
Figure 3. Bland and Altman plotting shows the concordance between LT and rMSSDT (A) and between LT and SD1T (B). (â—) coronary artery disease; (â–²) healthy group. Bias = mean of the differences between the means; ±1.96 = concordance limit of 95%; LT = lactate threshold; rMSSDT = rMSSD threshold (rMSSD = square root of the mean squared differences of successive RR intervals); SD1T = SD1 threshold (SD1 = standard deviation of Poincaré plot perpendicular to the line of identify).