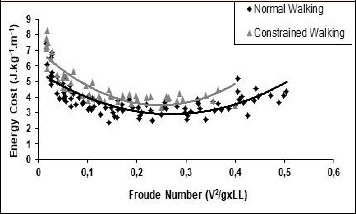
Figure 3.
Mean data graph displaying Energy cost (J·kg
-1
·m
-1
) in relation to Fr in normal and constrained walking.