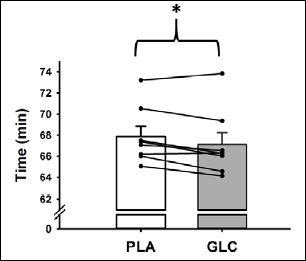
Figure 3.
Performance time for PLA and CHO 40 km cycle time-trials. Lines represent individual performances. Bar graphs represent mean ± SE. *p < 0.05 for CHO group mean compared with mean for PLA.