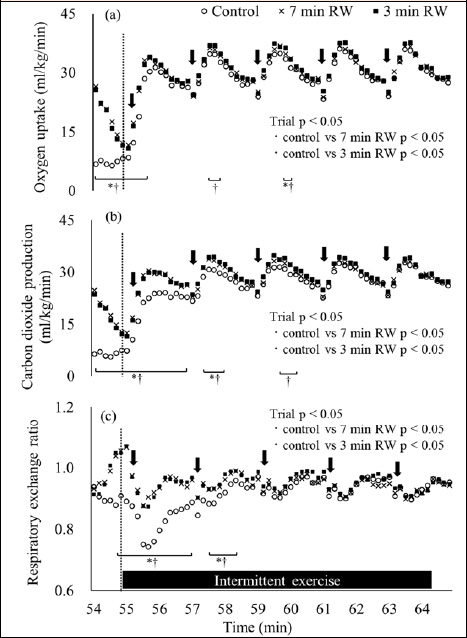
Figure 3. Oxygen uptake (a), carbon dioxide production (b), and respiratory exchange ratio (c) of the mean values at 54-65 min. Data are displayed as 10-s averages. Arrow represents 5-s sprints of the second intermittent exercise. Error bars is omitted for clarity. Control: 15 min of seated rest trial, 7 min RW: 7 min of the cycling at 70% of HRmax trial, 3 min RW: 3 min of the cycling at 70% of HRmax trial. (n=13, mean). Means were compared by using repeated measures two-factor analysis of variance followed by a Bonferroni multiple comparisons test. Oxygen uptake: a main effect of trial; p < 0.05, a main effect of time; p < 0.05, interaction; p < 0.05. Carbon dioxide production: a main effect of trial; p < 0.05, a main effect of time; p < 0.05, interaction; p < 0.05. Respiratory exchange ratio: a main effect of trial; p < 0.05, a main effect of time; p < 0.05, interaction; p < 0.05. * Significantly different between the control and the 7 min RW trials (p < 0.05). † Significantly different between the control and the 3 min RW trials (p < 0.05).
