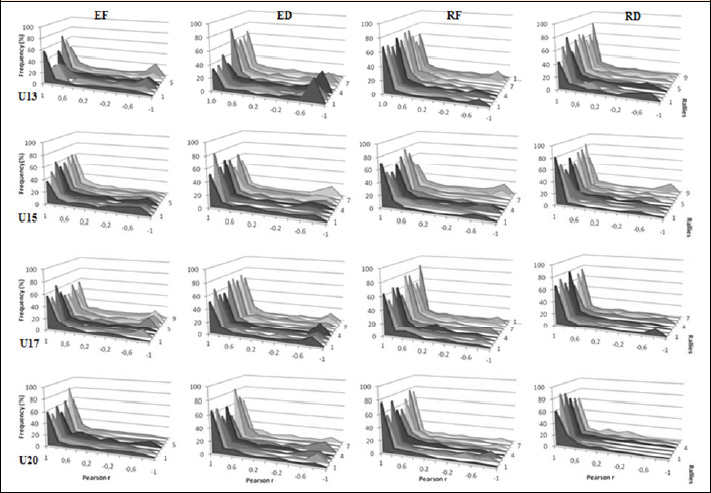
Figure 3.
Landscape of interaction patterns between marker and centroid. The lines correspond to the different age categories and the columns correspond to the different task constraints.