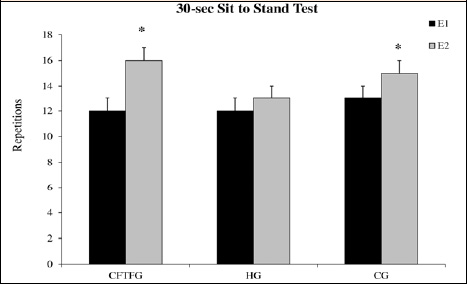
Figure 3. Evolution of the lower limb strength along the intervention in the combined face-to-face group (CFTFG); Home-based group (HG) and Control group (CG) during evaluation 1 (E1) and evaluation 2 (E2). * Statistical differences between E1 vs. E2 (p < 0.05).