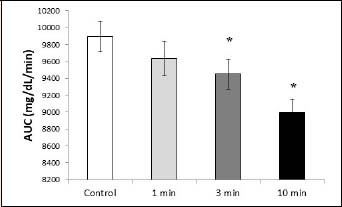
Figure 3.
Total AUC values for each trial. * Indicates statistical significance compared to control (p < 0.05). AUC = area under the curve.