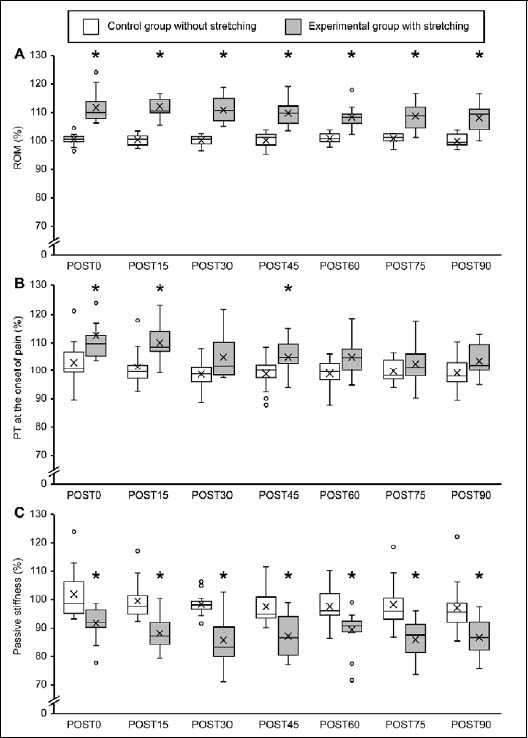
Figure 3. Boxplot figures showing percent changes in (A) range of motion, (B) passive torque at the onset of pain, (C) passive stiffness before and after dynamic stretching. The line within the box marks the median, crosses represent the mean, the boundary of the box indicates the 25th and 75th percentiles, the error bars indicate the 10th and 90th percentiles, and the dots above and below the error bars represent outliers. The asterisk indicates a significant (p < 0.05) difference from the time-matched control group. ROM, range of motion; PT, passive torque; PRE, before stretching; POST, after stretching
