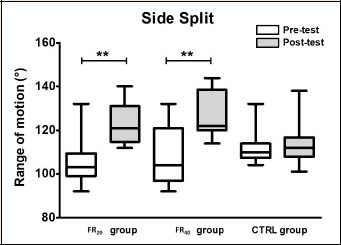
Figure 3. Side split performance measures before and after the foam rolling intervention. The figure shows the median and quartile values. The initial level of performance was comparable in the three groups. Only significant gains in ROM observed during post-hoc tests are displayed. **=p<0.01.