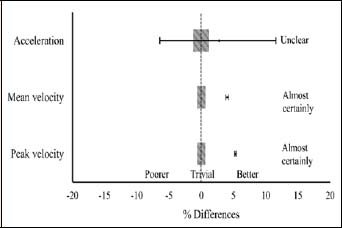
Figure 3. The changes in peak velocity, mean velocity, and acceleration of the repeated-sprint ability tests between the P1-IEP and P2-IEP in RWU in comparison to that of CON. Error bars indicate uncertainty in the true mean changes with 90% confidence intervals. Trivial areas were calculated from the smallest worthwhile changes. (Peak velocity: mean difference = 5.31%, ±90%CL = ±0.11%, QC = 99.9 / 0.0 / 0.1,; Mean velocity: 4.03%, ±0.2%, 99.7 / 0.1 / 0.2%; Acceleration: 2.60%, ±9.0%, 74.4 / 14.2 / 11.3%)