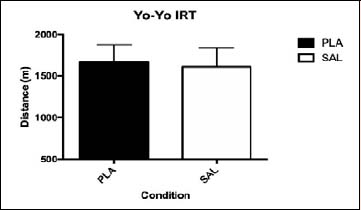
Figure 3.
Distance covered by SAL and PLA during the Yo-Yo IRT. Data are presented by Mean and SD.