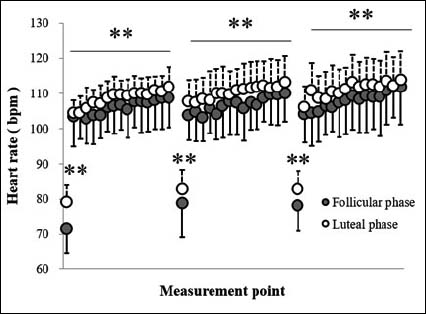
Figure 3. Heart rates during walking and after rest in the follicular and luteal phases. The values are presented as means ± standard deviation (n = 10). bpm, beats per min. ** p < 0.01. Three walking sessions, each lasting 15 min, were performed with a 5-min rest between them. Heart rate was measured every 1 min during walking and after each rest period. The heart rates during walking, after rest, and after recovery (30 min after the third walking session) in the luteal phase were all significantly higher than the values in the follicular phase, as revealed by the two-way ANOVA for repeated measures.