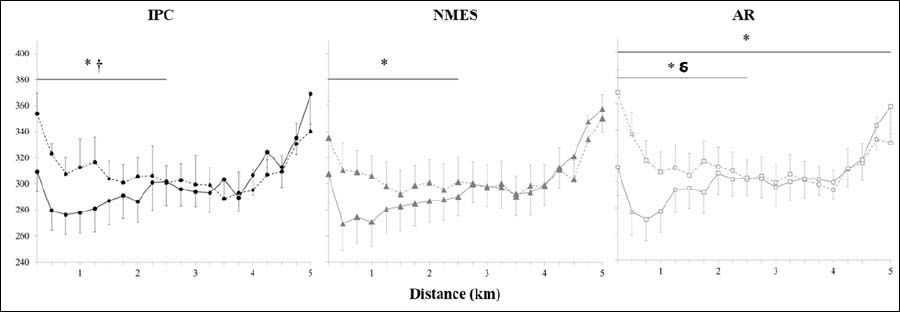
Figure 3. Power output profile during the 5-km time trials (TT1, dotted line; TT2, solid line) interspersed by IPC, AR or NMES (*) denotes clear differences within conditions at TT2 for the first half (IPC: ↓8.2%, ES -0.52 ± 0.27; AR: ↓8.2%, ES -0.52 ± 0.21; NMES: ↓7.2%, ES -0.46 ± 0.28), and the entire TT (AR: ↓3.5%, ES -0.22 ± 0.14), compared to TT1. Clear differences between IPC and NMES (-3.3%, ES -0.20 ± 0.32, †) and AR and NMES (4.7%, ES -0.29 ± 0.32, δ) at TT1 are denoted. Values are mean ± SE.