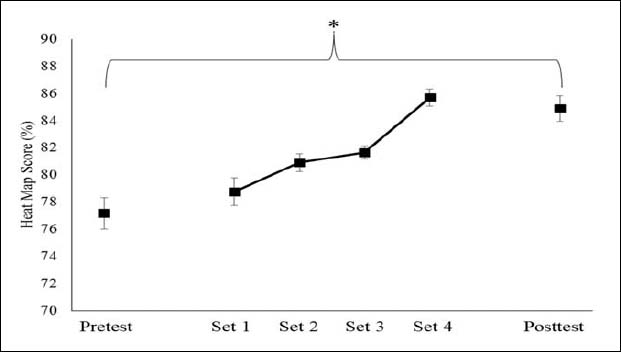
Figure 3.
Heat map scores. Error bars represent the standard deviation of the mean. *Significant improvement in heat map score from the pretest to posttest.