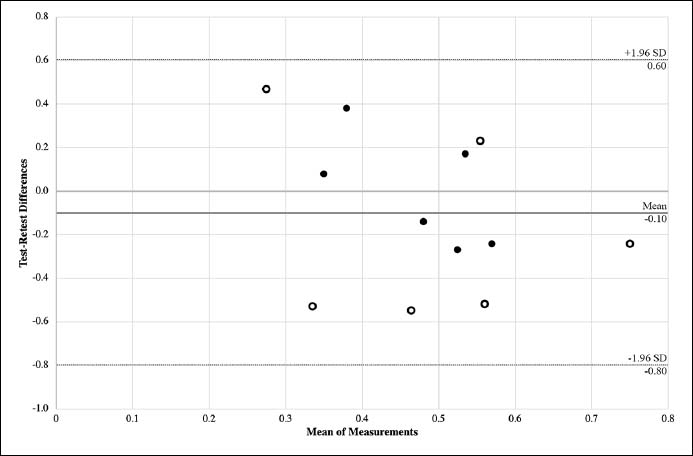
Figure 3.
Bland-Altman plot for the test-retest error in peak velocity (in m•s
-1
). Black dots represent acceleration runs and white dots deceleration runs.