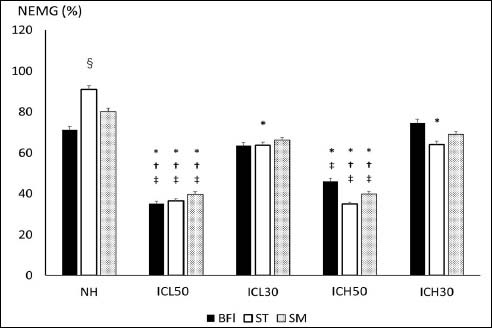
Figure 3. Comparison of the NEMG (%) of BFlh, ST, and SM muscles among NH, ICL50, ICL30, ICH50, and ICH30. *, † , and ‡ represent a significant difference (p < 0.05) when NH, ICL30, and ICH30 are compared. § represents a significant difference (p < 0.05) between ST and BFlh.