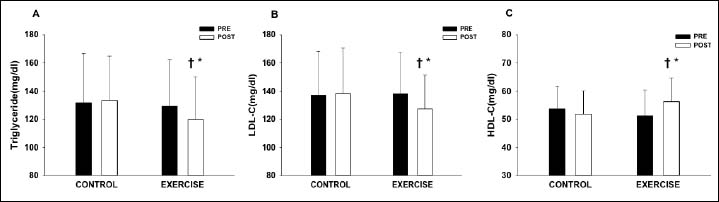
Figure 3. Changes in TG, HDL-C, and LDL-C pre and post 12 weeks in control (CON) and exercise (EX) groups. (A) TG was significantly reduced in post EX compared to post CON. (B) HDL-C was significantly greater in post EX compared to post CON. (C) LDL-C was significantly reduced in the EX group. Values are Mean ± SD. * p < 0.05 vs. Pre. † p < 0.05 vs. CON.