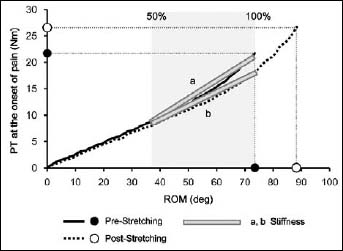
Figure 3. Representative torque-angle curve values. Typical torque-angle curve response of one subject before and after passive static stretch. Stiffness was determined from the slope of the regression between 50% and 100% of the range of motion (ROM)–passive torque (PT) relationship.
