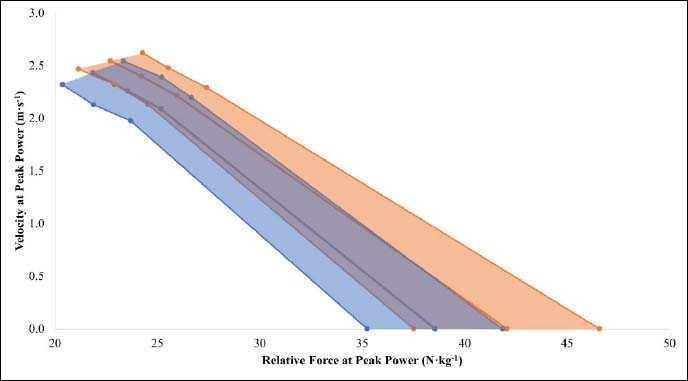
Figure 3.
PULL group pre- (Blue) and post-intervention (Orange) force-velocity curves with 95% confidence intervals.