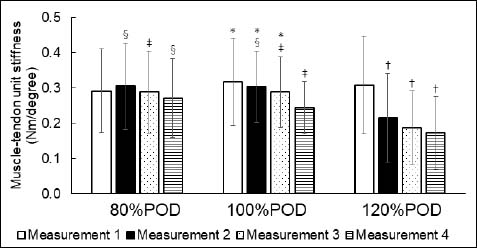
Figure 3. Change in muscle-tendon unit stiffness. Data were represented as mean ± standard deviation. * p < 0.01 vs. value at 100%POD in Measurement 4. † p < 0.01 vs. value at 120%POD in Measurement 1. ‡ p < 0.01 vs. value at 120%POD at same time. $ p < 0.05 vs. value at 120%POD at the same time. POD: point of discomfort.