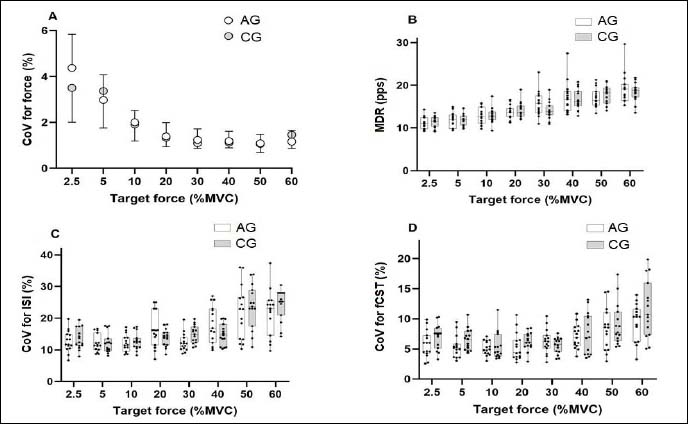
Figure 3. Force varibility during the steady submaximal contractions with the dorsiflexors of the dominant leg at eight taget forces by the athletes who trained with either alternating or bilateral leg actions. A. Coefficient of variation (CoV) for force (mean ± SD); B. Mean discharge rate (MDR). C. Coefficient of variation (CoV) for interspike interval (ISI); D. Coefficient of variation (CoV) for filtered cumulative spike train (fCST). In B, C, and D, data are shown as box graphs with “whiskers” displaying the 5-number summary of the data: the maximum limit (upper whisker), the 3rd quartile (75th percentile), the median value (line inside the box), the first quartile (25th percentile) and the minimum limit (lower whisker). AG = group trained with alternating leg actions; CG = group trained with bilateral leg actions.