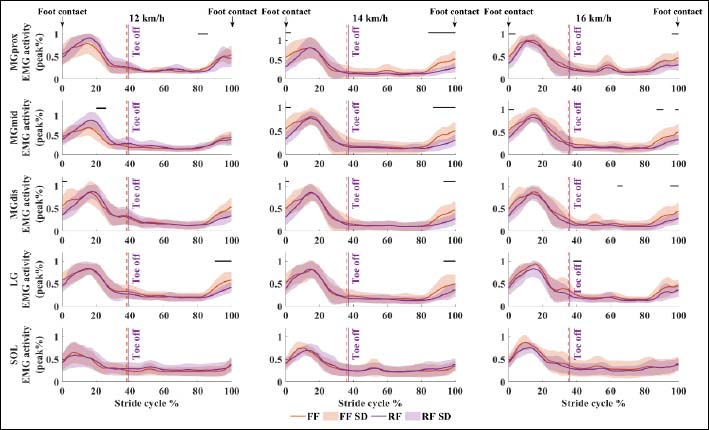
Figure 3. Plantarflexor EMG activity during forefoot and rearfoot strike running. Comparisons of group means and SD of the normalized electrical activity (all EMG channels averaged per muscle and normalized to maximum activity) at 12 km·h-1, 14 km·h-1, and 16 km·h-1 running speeds between forefoot (FFS) and rearfoot strike (RFS) running. Vertical dashed lines define the sub-phases of the running stride (0-100%) as stance phase (from foot strike at 0% to maximum knee angle in stance at toe-off) and swing phase (from toe-off to initial foot contact at 100%). The solid purple and orange vertical lines show the end of stance phase during FFS and RFS running, respectively. The black solid lines show the results of the SPM paired t-test between FFS and RFS. When the calculated SPM{t}value crossed the critical threshold at any point or region, the difference was statistically significant and was marked with a black line.