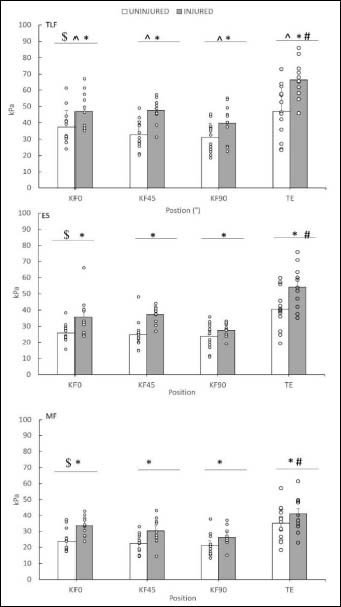
Figure 3. Mean group active SWE modulus values of thoracolumbar fascia (TLF), erector spinae (ES), multifidus (MF) values during submaximal contractions of the knee flexors at 0 (K0), 45 (K45) and 90° (K90) knee flexion angles and during prone trunk extension of 30° (TE). Error bars indicate standard deviation and circle dots are individual case values (* indicates statistically significant difference between groups, ^ values collapsed for groups and angles are greater compared to ES and MF values; # values collapsed for groups and tissues are greater compared to K0, K45 and K90; $ values collapsed for groups and tissues are greater than K90, p < 0.05).