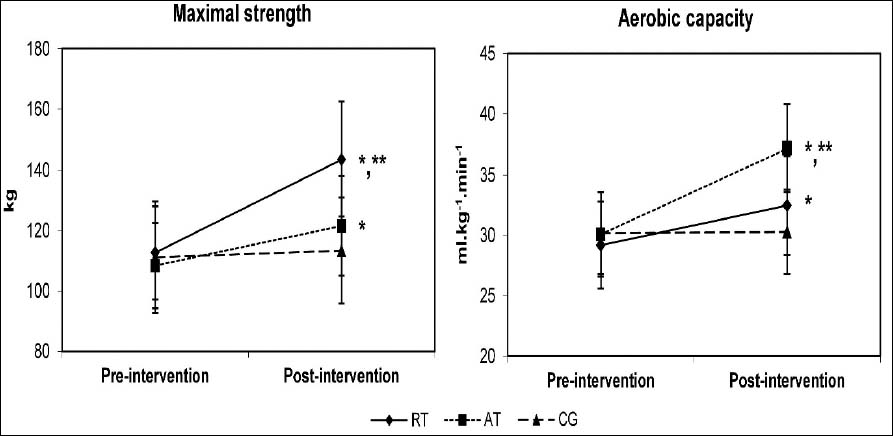
Figure 3. Changes in maximal strength and aerobic capacity from pre to post-intervention in the groups (mean ± SD). * Significant differences vs. pre-intervention and CG (p < 0.05). ** Significant differences vs. AT in maximal strength and vs. RT in aerobic capacity (p < 0.05).