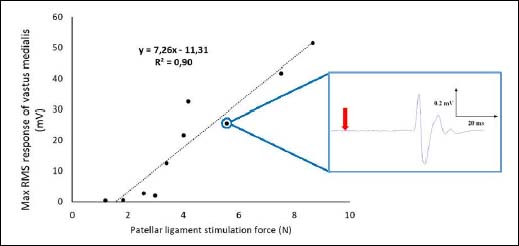
Figure 3. Representative data from 1 participant. Dotted line: linear model of the relation. On the right: an example of the EMG wave of the m. vastus medialis during T reflex testing. The red arrow represents the moment of patellar ligament stimulation.
