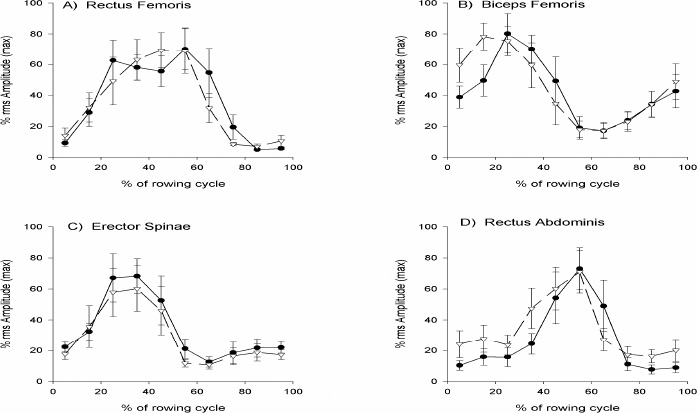
Figure 4. . The group mean ensemble muscle activity profiles over the rowing cycle (Mean ± Standard Error of the Mean, n=6). Each point represents mean muscle amplitude for the 10% interval normalised to the group mean maximal rms amplitude detected over the rowing cycle for Concept 2C (filled circles, solid lines) and for Rowperfect (hollow circles, dashed lines). Each graph represents one of the four muscles studied: A) m. Rectus Femoris, B) m. Biceps Femoris, C) m. Erector Spinae, and D) m. Rectus Abdominis.