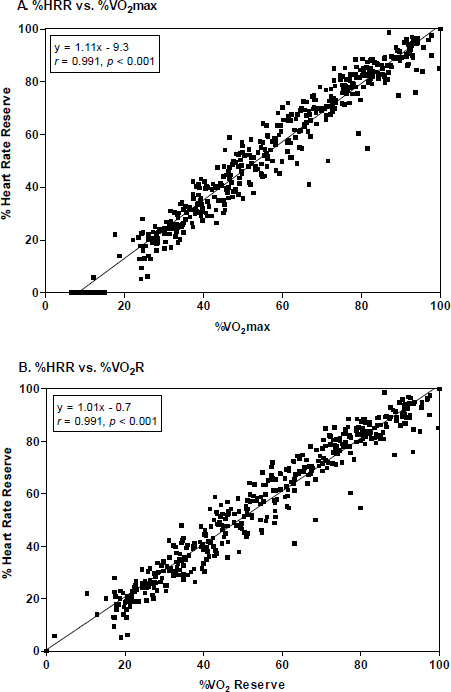
Figure 4.
Scatterplot and regressions of (A; N=48) %HRR vs. %VOmax and (B; N=48) %HRR vs. %VOR for the elliptical crosstrainer group