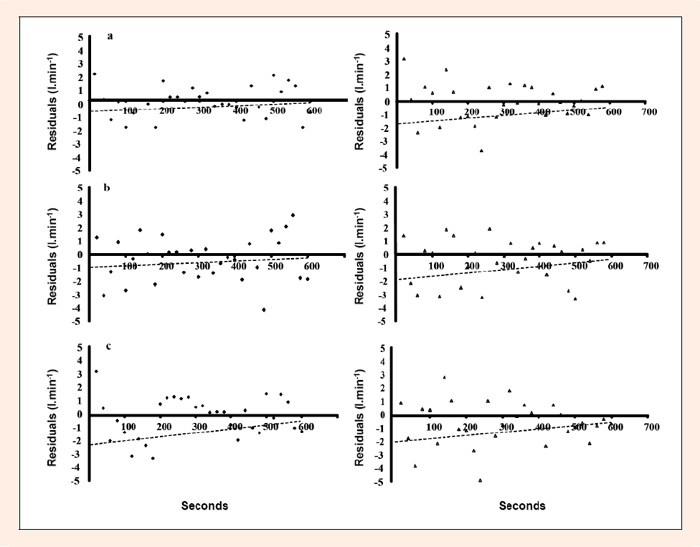
Figure 4.
Residual distribution of three mathematical models in UT () and TR () groups. The panels a, b and c are 2SRM, 3SRM and GEM, respectively. The dotted line is the linear regression on the residuals.