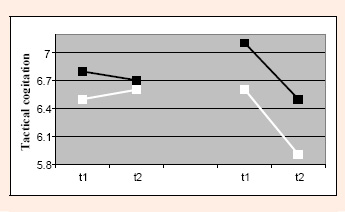
Figure 4.
Diagram of the age-specific differences (age-group 1991: black; age-group 1992: white) with regard to the divergent (left) and convergent performance parameters (right).