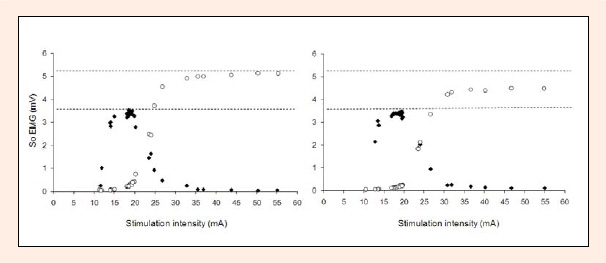
Figure 4.
H-reflex recruitment curves (♦ H-reflexes, ○ M waves) of one subject before and after RPMS. It becomes apparent, that M was reduced after RPMS