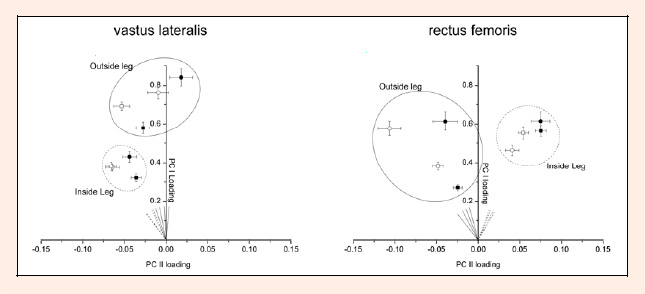
Figure 4. Principal component loading scores for PC I and PC II during recreational alpine skiing for m. vastus lateralis (VL, left graph) and for m. rectus femoris (RF, right graph). Each point shows the mean ± s.e.m. loading scores pooled from the six subjects. Data points within the solid circle represent outside leg while points within the dashed circle represent inside leg (solid symbols = PREskiing; open symbols = POSTskiing; circles = TOP of the run; squares = END of the run). The direction of the vectors in the PC I-PC II scoring plane represents angle θ¸ and is visualized by solid (outside leg) and dashed lines (inside leg)