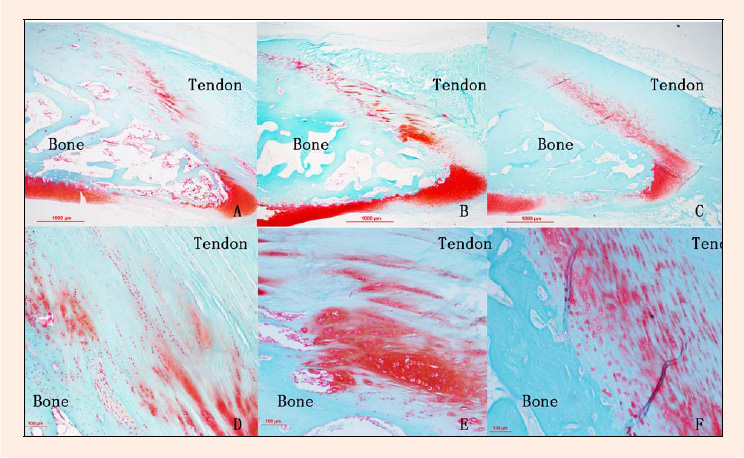
Figure 4.
Safranin O staining indicated an indistinct proteoglycan profile and reduced area in the AI group (A, D) and PIERT group (B, E) relative to the CON group (C, F). (10× for A, B, C and 20× for D, E, F).