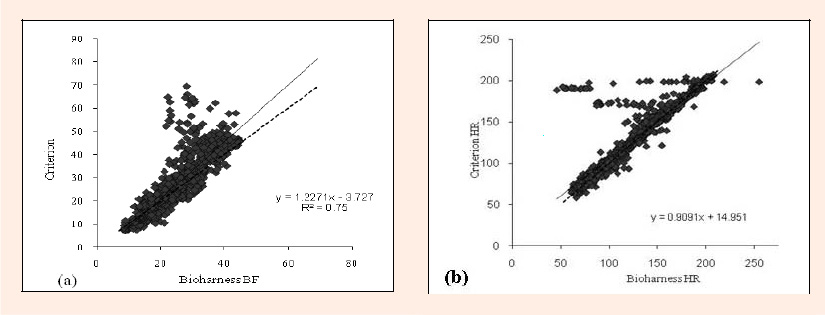
Figure 4.
Scatter plot demonstrating the relationship between (a) Bioharness BF and Criterion and (b) Bioharness HR and Criterion across all velocities on treadmill. Nb. line of identity (- - - -), regression line ().