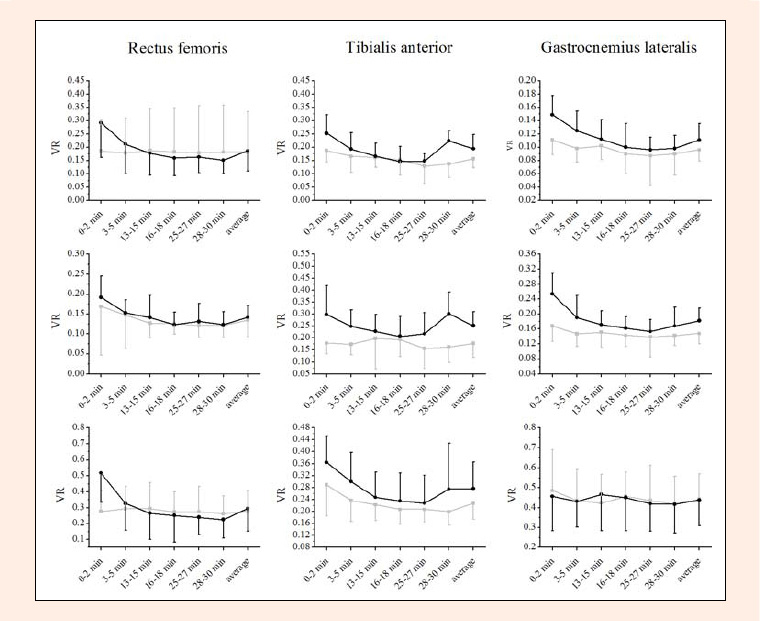
Figure 4.
Mean (±SD) variance ratios for EMG data for stride (top), stance (middle) and swing (bottom). Grey lines represent NT, black lines show RT means.