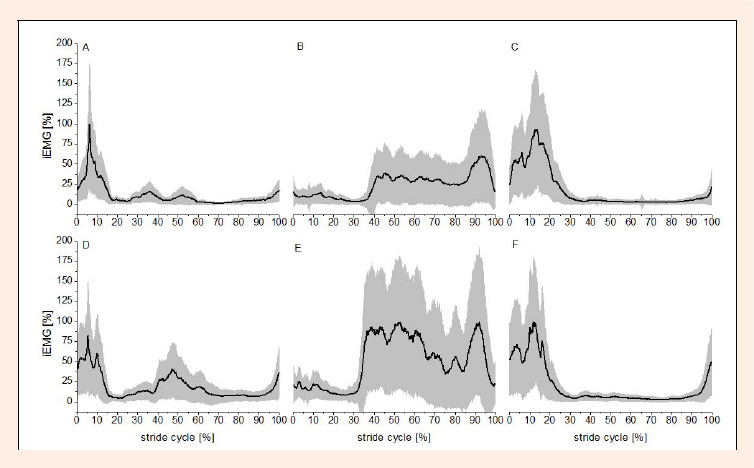
Figure 4. Mean (±standard deviation) of the EMGs of each muscle graphed as a function of a standardized stride cycle (0-100 % from right heel strike to the next right heel strike) of one participant. For illustrative purposes linear envelopes were calculated (10 Hz low-pass filter using a fourth order zero-lag digital Butterworth filter) and subsequently normalized to the mean muscle activation of running without elastic tubes at each time instant. That is, the percentage of muscle activation displayed on the y-axis is in relation to the mean muscle activation during running without tubes. Graphs A-C show muscles when running without tubes, in graphs D-F the tube running condition is displayed (rectus fem: graphs A and D; tibialis anterior: B and E; gastrocnemius lat.: C and F). Black lines show mean muscle activation with the gray area expressing standard deviation