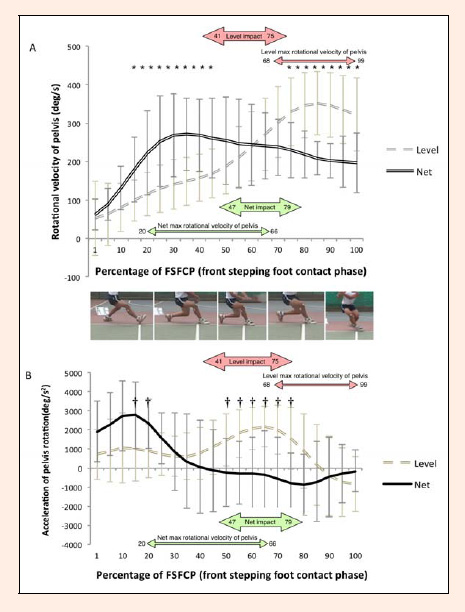
Figure 4. . The thick arrows indicate the range of impact timing for each participant with black representing the Level group and white representing the Net group. The thin arrows indicate the range of max velocity timing for each subject. * Significant difference at rotation velocity (p < 0.05). † Significant difference at acceleration of pelvis rotation (p < 0.05).