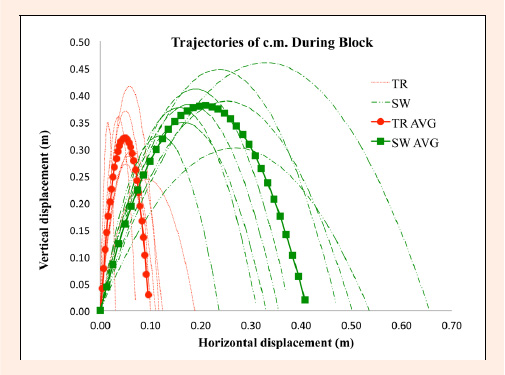
Figure 4.
Trajectories of c.m. for TR and SW airborne phases (with respect to location of c.m. at takeoff). Average TR trajectory is marked by red circles. Average SW trajectory is marked by green squares.