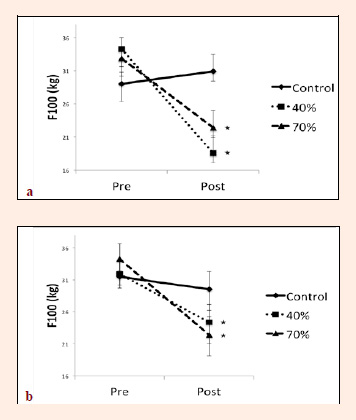
Figure 4. F100 pre-post intervention. Representation of F100 in the dominant, fatigued-leg (a) and non-dominant, non-exercised leg (b), pre- and post-intervention. Variation in data indicated by standard error. Significance was set at p < 0.05. * indicates significant pre-post intervention differences.