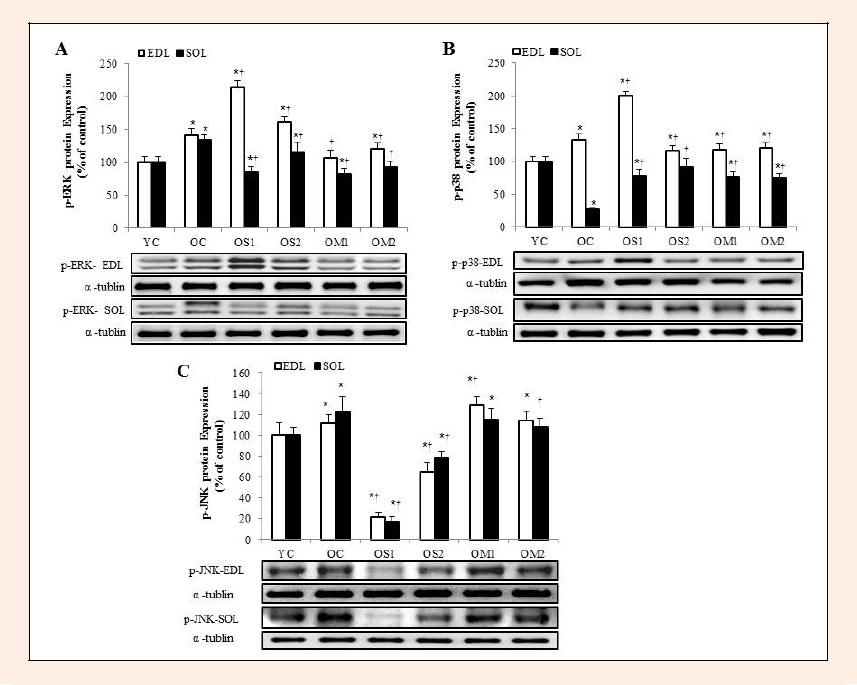
Figure 4. The expression levels of p-ERK (A), p-p-38 (B), p-JNK (C) proteins in the extensor digitorum longus (EDL) and soleus (SOL) muscles. Data are presented as percentage of mean YC values. Representative blots are shown. The symbol * indicates = significantly different from the YC group (p < 0.05).The symbol † indicates = significantly different from the OC group (p < 0.05).