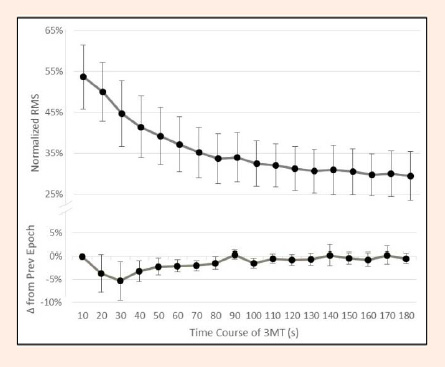
Figure 4.
Electromyography amplitude (RMS) normalized to maximal RMS and change (∆) in RMS compared to the previous 10s epoch throughout the three-minute maximal cycling test (3MT). Data are reported as mean values ± 95% confidence intervals.