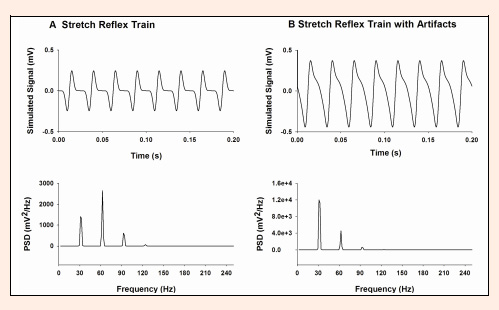
Figure 4. Computer simulated signal of (A) a stretch reflex train and (B) a stretch reflex train contaminated with motion artifacts in the time domain (upper panel) and Power Spectral Density (PSD, lower panel) at 30 Hz. The ratio

was γ = -0.30 for the signal illustrated in (A) and γ = 0.45 for the signal illustrated in (B).