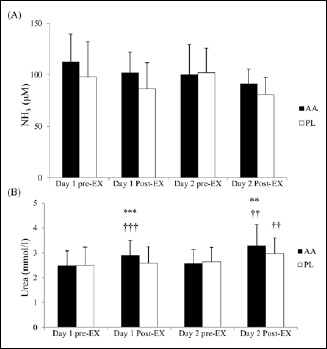
Figure 4. Plasma concentrations of (A) NH3 and (B) urea in the AA and PL trials. Main effects: (A) trial: p = 0.182; time: p = 0.056; interaction: p = 0.560; (B) Main effects: trial: p = 0.213 ; time: p < 0.001; interaction: p = 0.007. * p < 0.05; ** p < 0.01; *** p < 0.001, AA vs PL trial at the same time point. † p < 0.05; † † p < 0.01; † † † p < 0.001, different from the pre-Ex at the same day in the same trial