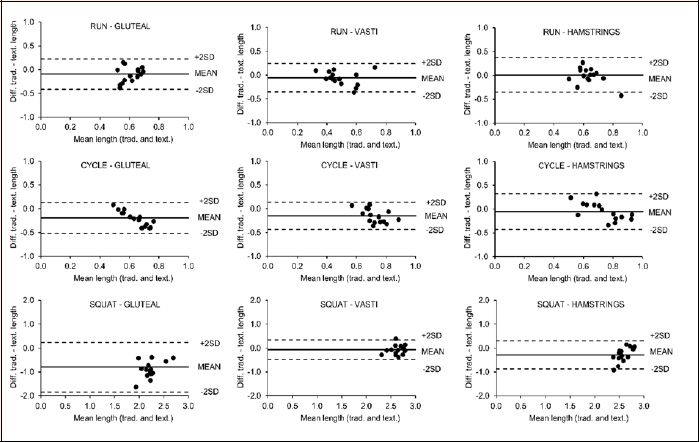
Figure 4. Bland-Altman plots for the lengths of excitation bursts during running, cycling and squatting measured using textile (text.) and traditional surface (trad.) EMG electrodes. Each point represents one participant, solid lines denote mean differences and dotted lines denote ±2SD.