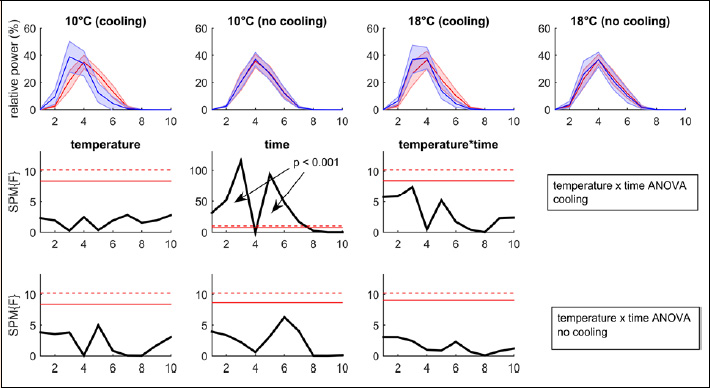
Figure 4. SPM 3-way ANOVA for the MVC. The first row presents the mean (± SD) relative power spectra across the 10 wavelet bands in each condition at pre-test (red) and post-test (blue). Second and third rows present the results of the post-hoc two-way temperature x time ANOVA for cooling and no cooling respectively. Red horizontal lines depict the critical F-values (full line non-parametric, dashed line parametric).